Projects
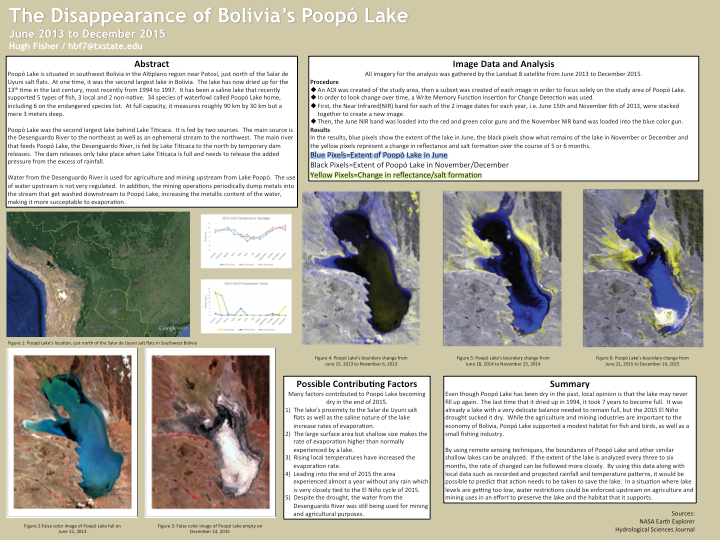
This final project from my Digital Remote Sensing class uses International Space Station imagery during the wet and dry seasons of 2013, 2014 and 2015 to monitor the drying up of Bolivia's Lake Poopó. The final project was printed out to poster size, so unfortunately some text is difficult to read in this format.
(Click on image above to enlarge)
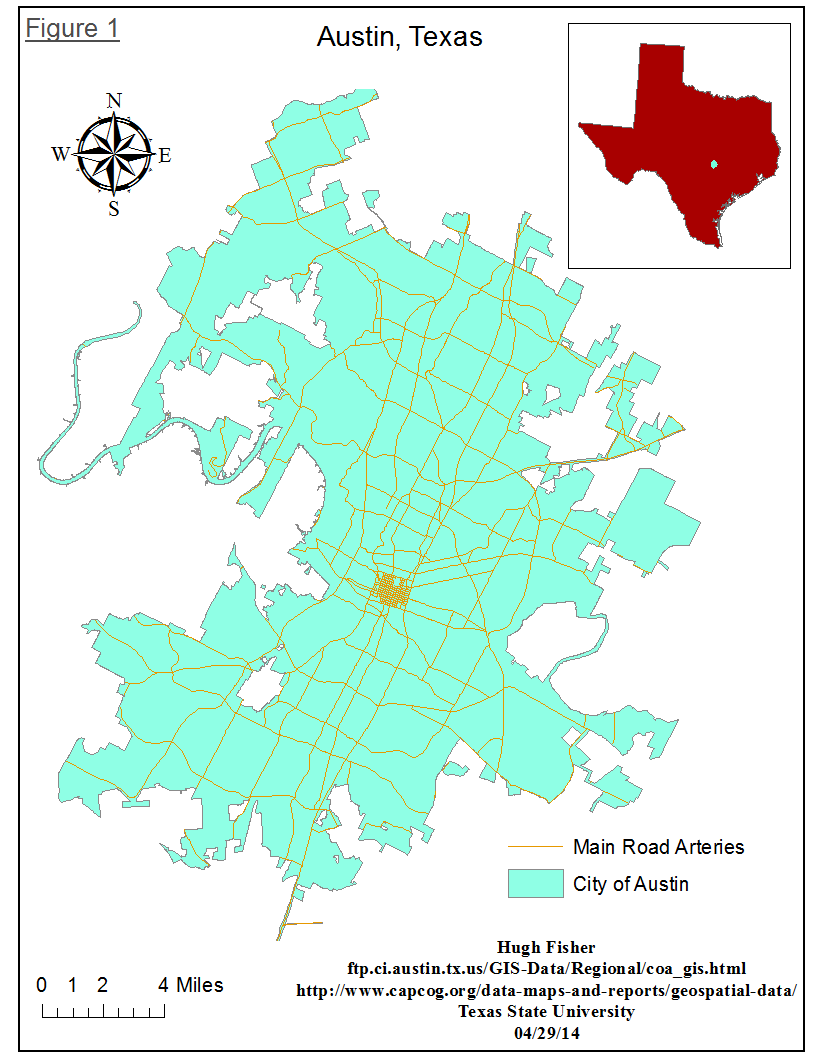
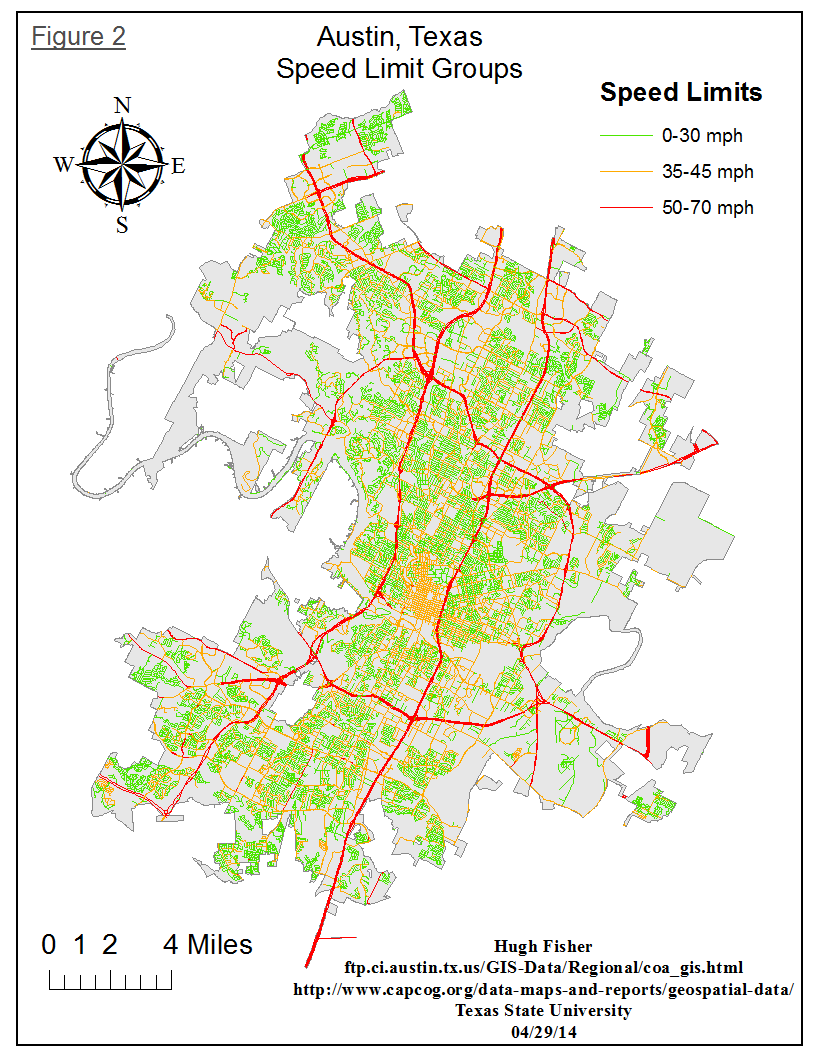
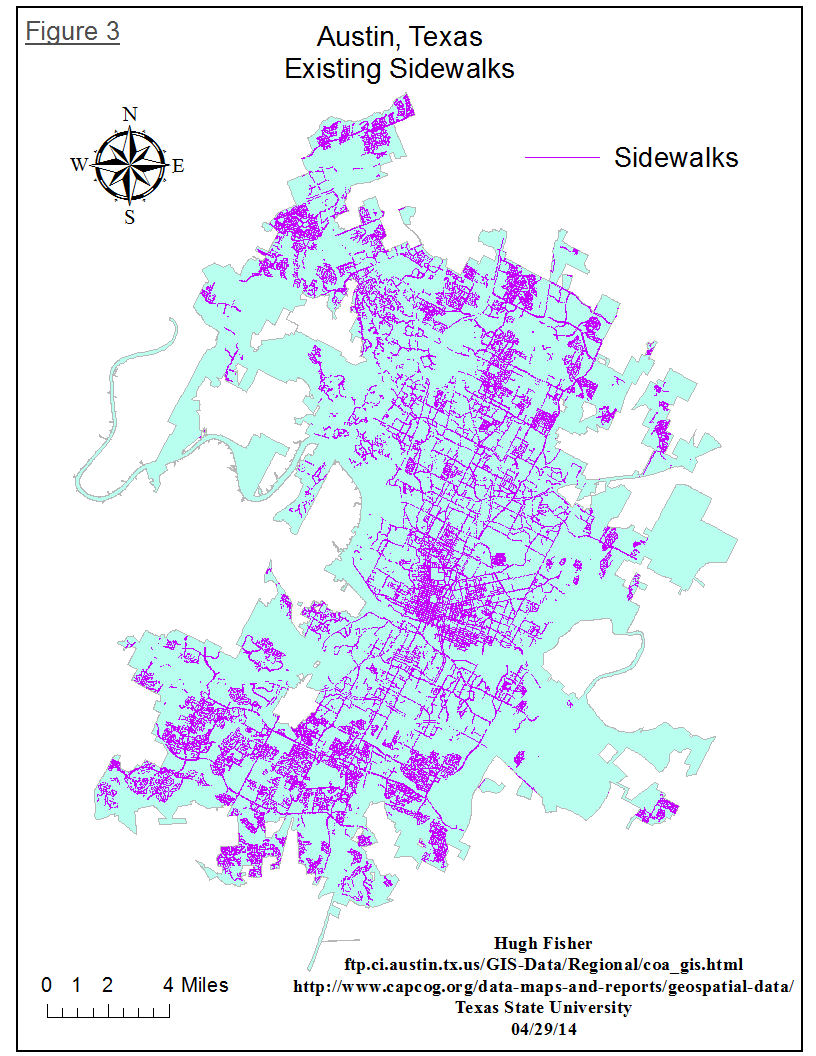
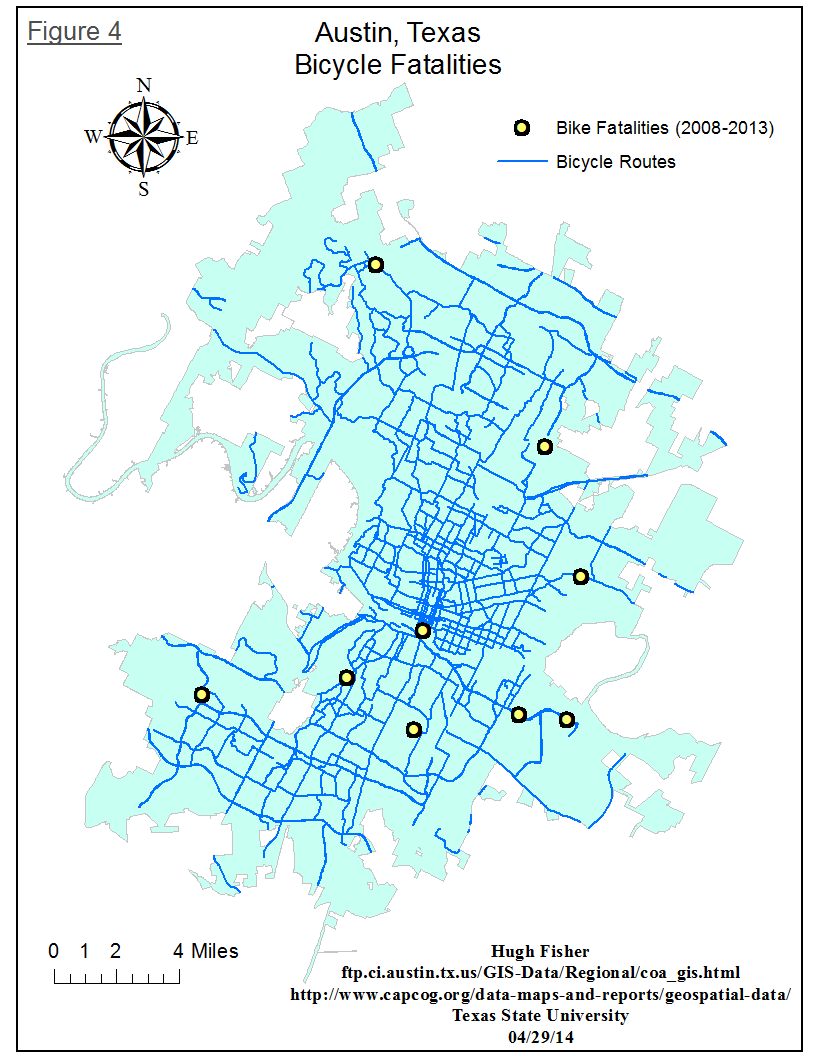
The above maps are from a final project for my intro to GIS class. I set out to determine what some of the safest ways to travel on a bicycle in Austin, TX are. My criteria are that the route is at least 1/2 mile from a previous bike fatality, roads have sidewalks, speed limits and existing bike routes in Austin. Figures 1-4 show the steps of my process. Figure 1 has a clipped shapefile of major roadways and the city limits of Austin. In figure 2, I categorized all roads into 3 groups, according to speed limit information found in the attribute table. Figure 3 is a little busy, but it is all of the roads within Austin city limits that have sidewalks. In figure 4, I created a point layer with known bicycle fatalities and preexisting bike routes in Austin, clipped to a shapefile of the city limits of Austin, TX.
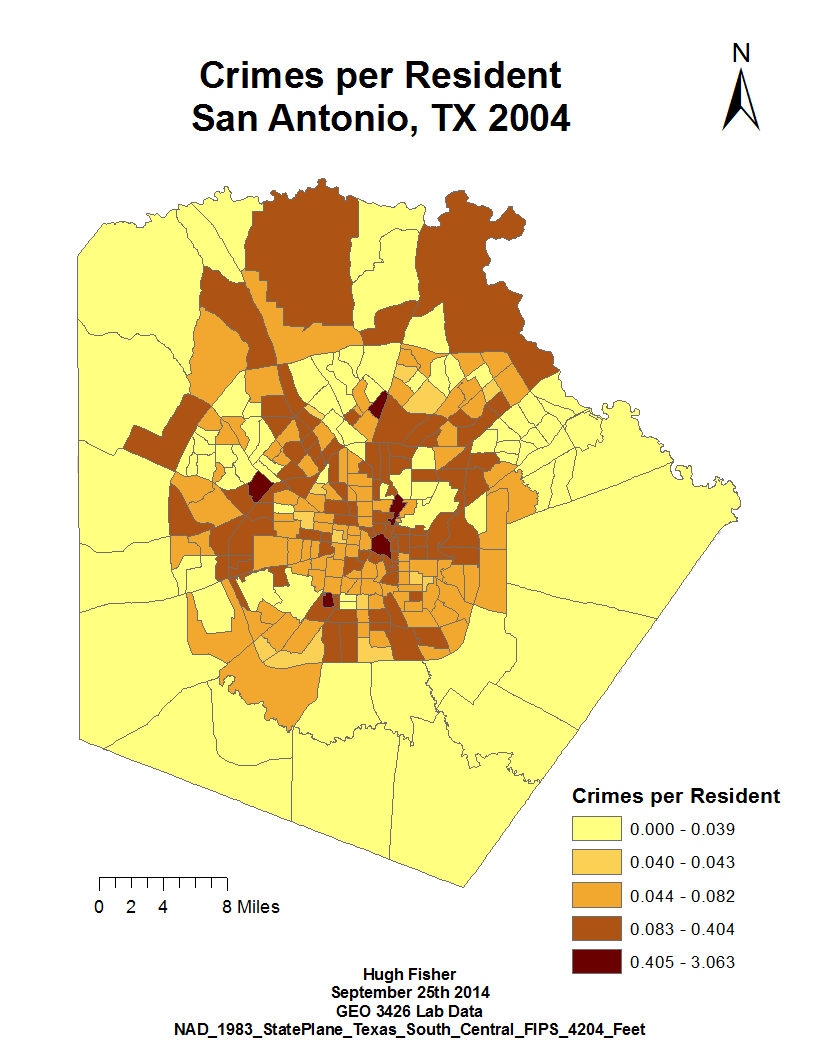
This project takes crime data, normalized per resident of San Antonio, Texas for 2004. In hindsight, the project would be a bit more visually pleasing to normalize the crime data to every 100 or 1000 residents, so that the numbers in the legend would be a little larger. Also, using a Quantile or Equal Interval Classification would probably suit this data set better.
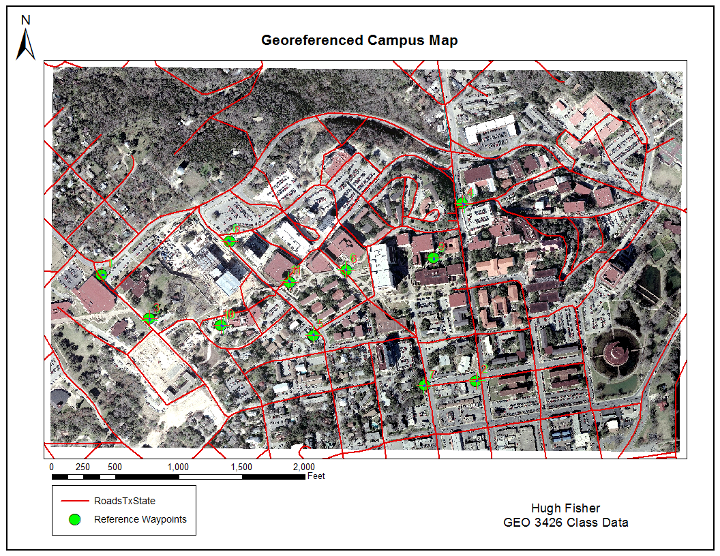
This project is a pretty basic introduction to georeferencing. In small groups, we dropped GPS Waypoints around Texas State University's campus with a brief description of where it was. Then, we took an unprojected image of the campus and georeferenced the GPS points to points on the image and traced streets lines, creating a projected, vector layer on campus.
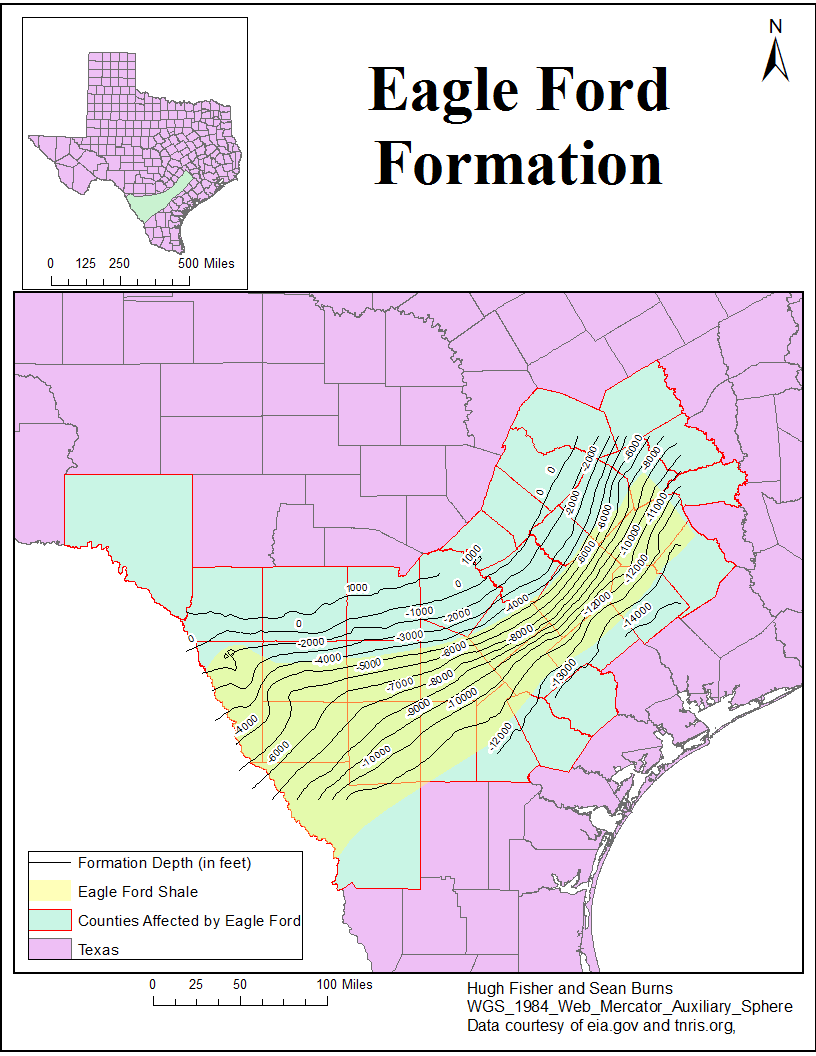
I created this map for a final group project for my Geomorphology class. We looked at the Eagle Ford formation in South Texas, which is the largest oil and natural gas reserve in Texas. For the project, we did a report and presentation on how the shale was formed, the depths at which natural gas and oil are found, as well as statistics on how the local area has been positively and negatively affected.
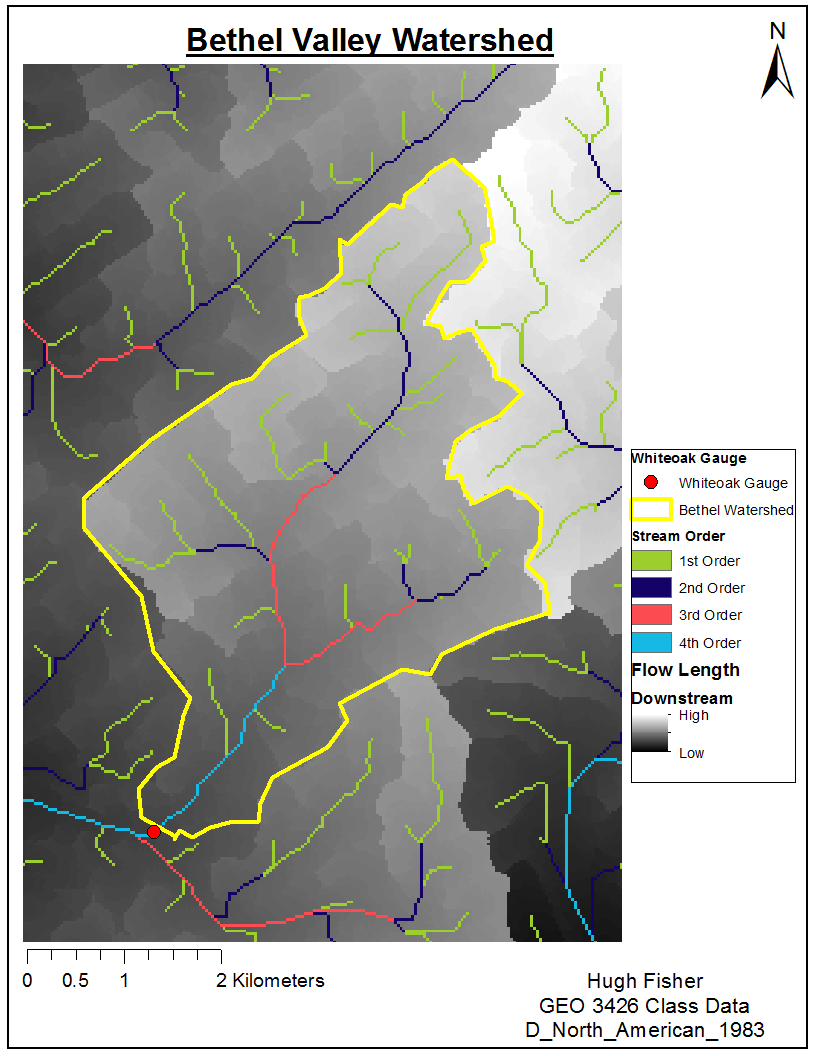
This project takes a Digital Elevation Model (DEM) and over lays a river layer and the Bethel Valley Watershed in East Tennessee. Then, I labeled the stream orders of the streams in the area. The Bethel Valley Watershed has been used for hazardous waste experimentation by the government since the 1940's. The soil and water are contaminated, so the flow of water in and out of the watershed should be closely monitored.
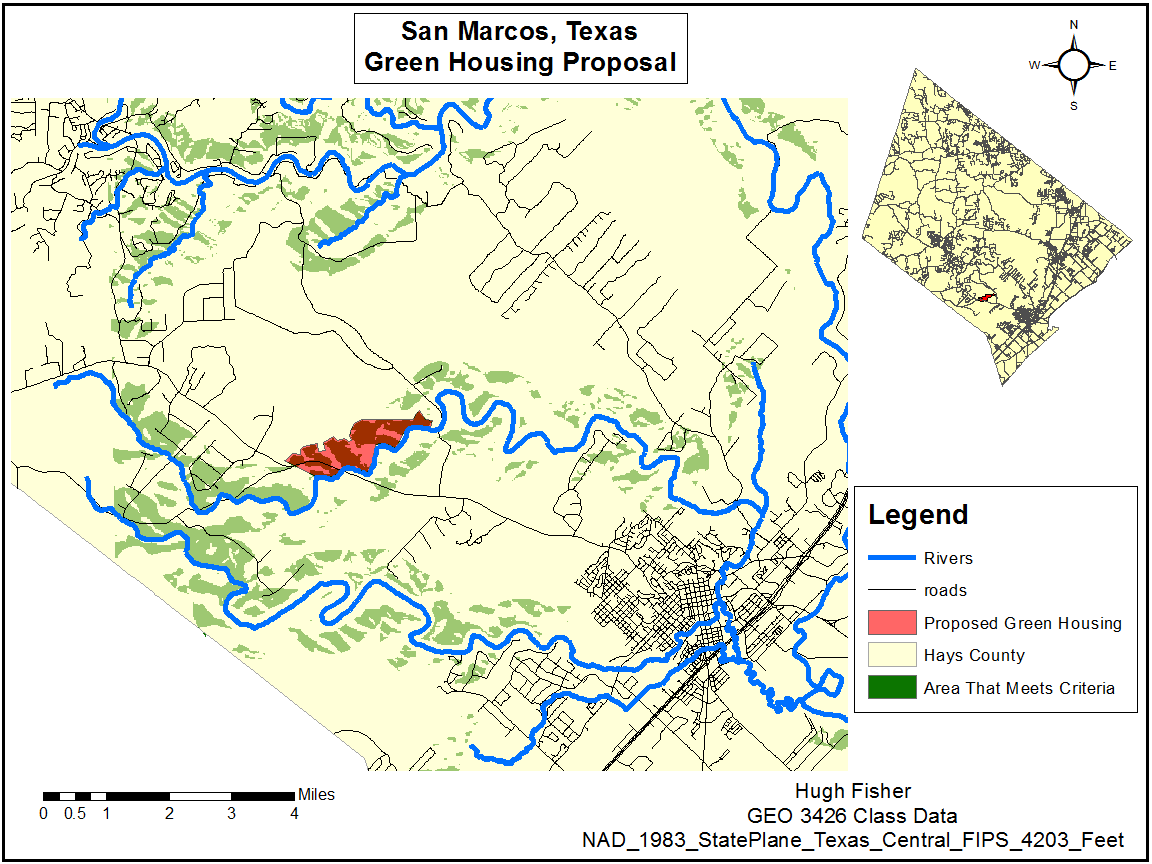
Looking for a new location for a green housing project in the San Marcos, TX area, I searched for areas that were close to the river but out of the flood plain and were far enough away from I-35. End the end, I chose the proposed area because of the cluster of area that meets the criteria and is easily accessed by existing roads.
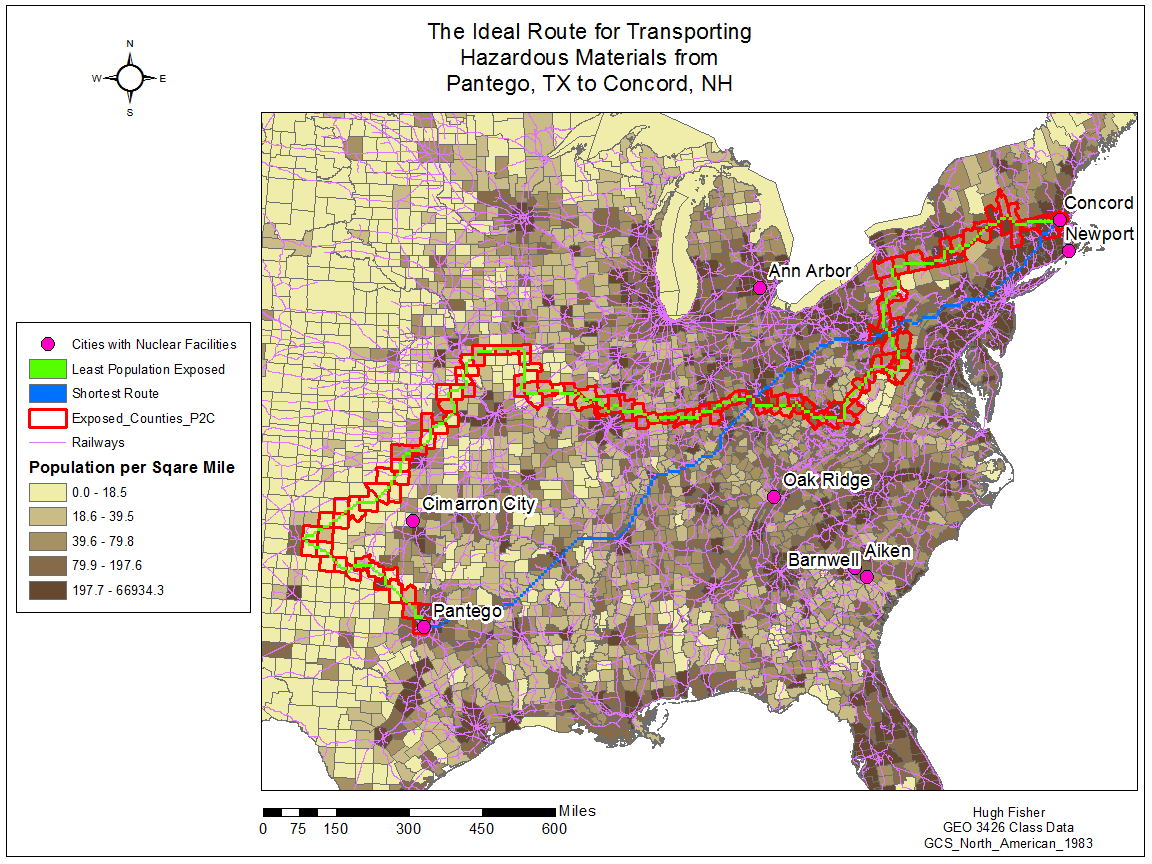
This map finds the shortest route via railway from Pantego, TX to Concord, NH, as well as the least populated route that stays away from other cities that have nuclear facilities.
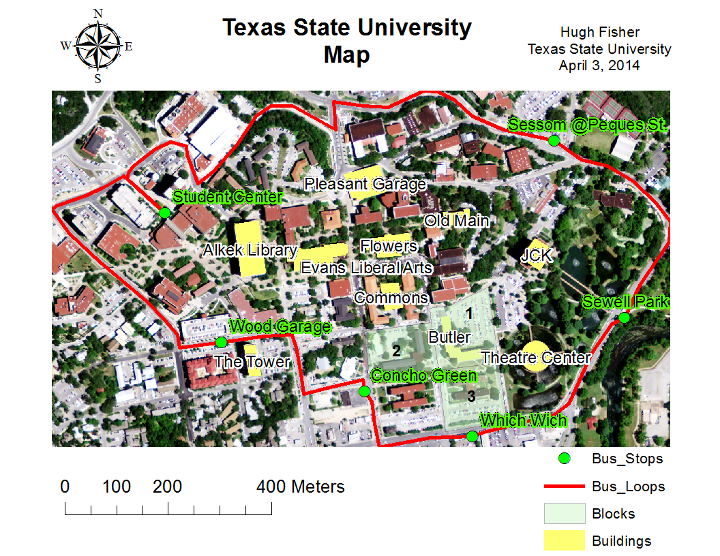
This map started as an image of the Texas State University campus. I created a shapefile, digitized a few buildings, labeled the buildings, added a line layer of the bus loop and added a point layer with bus stops on that route.